# Load packages.
library(ggplot2)
library(tidyverse)
── Attaching core tidyverse packages ──────────────────────── tidyverse 2.0.0 ──
✔ dplyr 1.1.4 ✔ readr 2.1.6
✔ forcats 1.0.1 ✔ stringr 1.6.0
✔ lubridate 1.9.4 ✔ tibble 3.3.1
✔ purrr 1.2.1 ✔ tidyr 1.3.2
── Conflicts ────────────────────────────────────────── tidyverse_conflicts() ──
✖ dplyr::filter() masks stats::filter()
✖ dplyr::lag() masks stats::lag()
ℹ Use the conflicted package (<http://conflicted.r-lib.org/>) to force all conflicts to become errorslibrary(tidymodels)── Attaching packages ────────────────────────────────────── tidymodels 1.4.1 ──
✔ broom 1.0.12 ✔ rsample 1.3.2
✔ dials 1.4.2 ✔ tailor 0.1.0
✔ infer 1.1.0 ✔ tune 2.0.1
✔ modeldata 1.5.1 ✔ workflows 1.3.0
✔ parsnip 1.4.1 ✔ workflowsets 1.1.1
✔ recipes 1.3.1 ✔ yardstick 1.3.2
── Conflicts ───────────────────────────────────────── tidymodels_conflicts() ──
✖ scales::discard() masks purrr::discard()
✖ dplyr::filter() masks stats::filter()
✖ recipes::fixed() masks stringr::fixed()
✖ dplyr::lag() masks stats::lag()
✖ yardstick::spec() masks readr::spec()
✖ recipes::step() masks stats::step()library(here)here() starts at C:/Users/aniss/Desktop/anissawallerdelvalle-portfolio# Set random seet.
set.seed(1234)
rngseed <- 1234
# Load the cleaned dataset from fitting-exercise.qmd.
model_data <- readRDS(here("ml-models-exercise", "model_data.rds"))
# Inspect the data
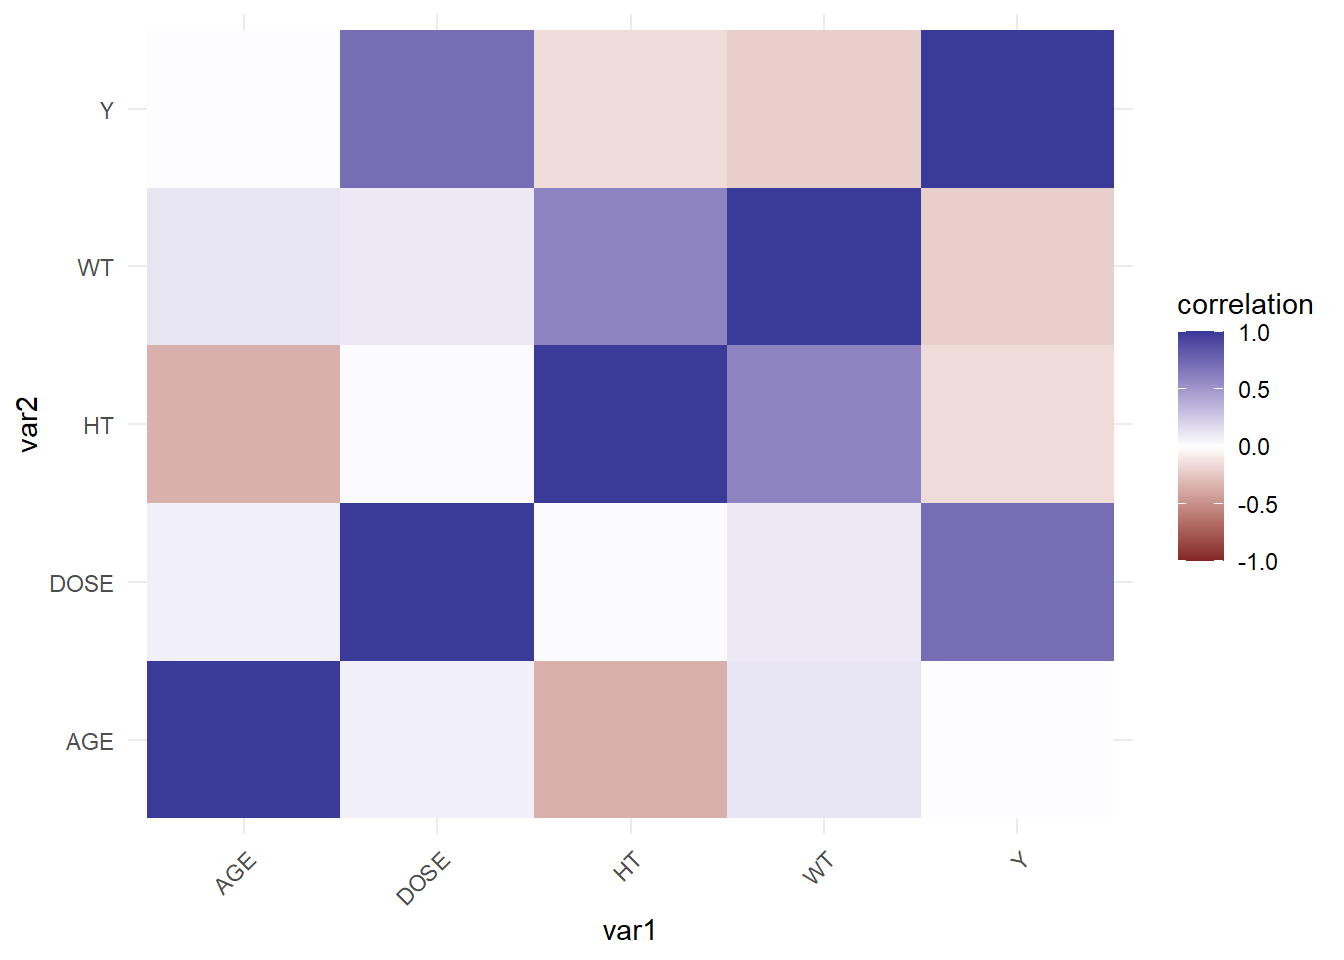
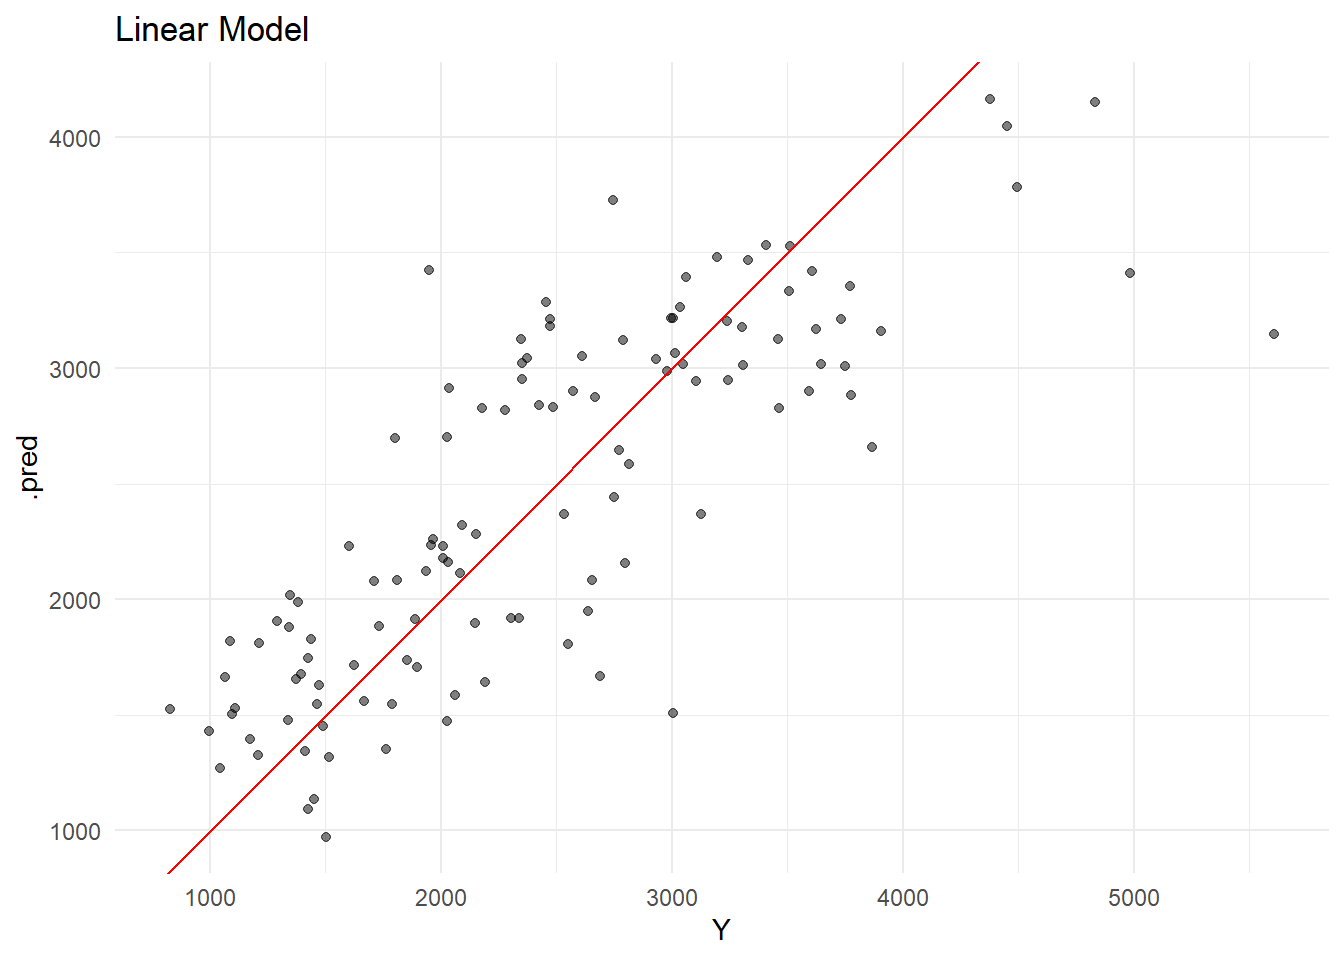
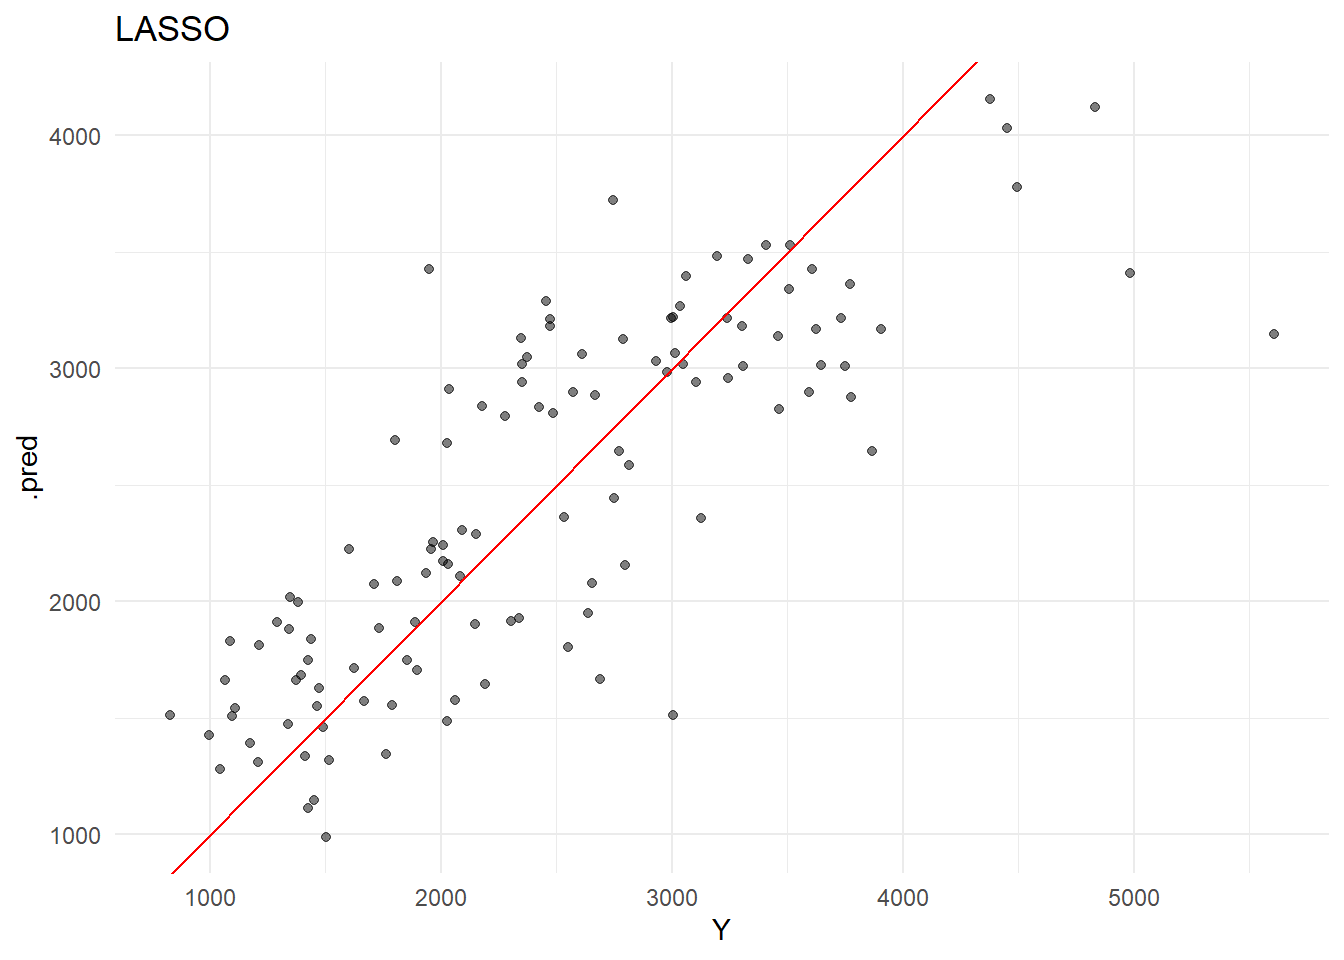
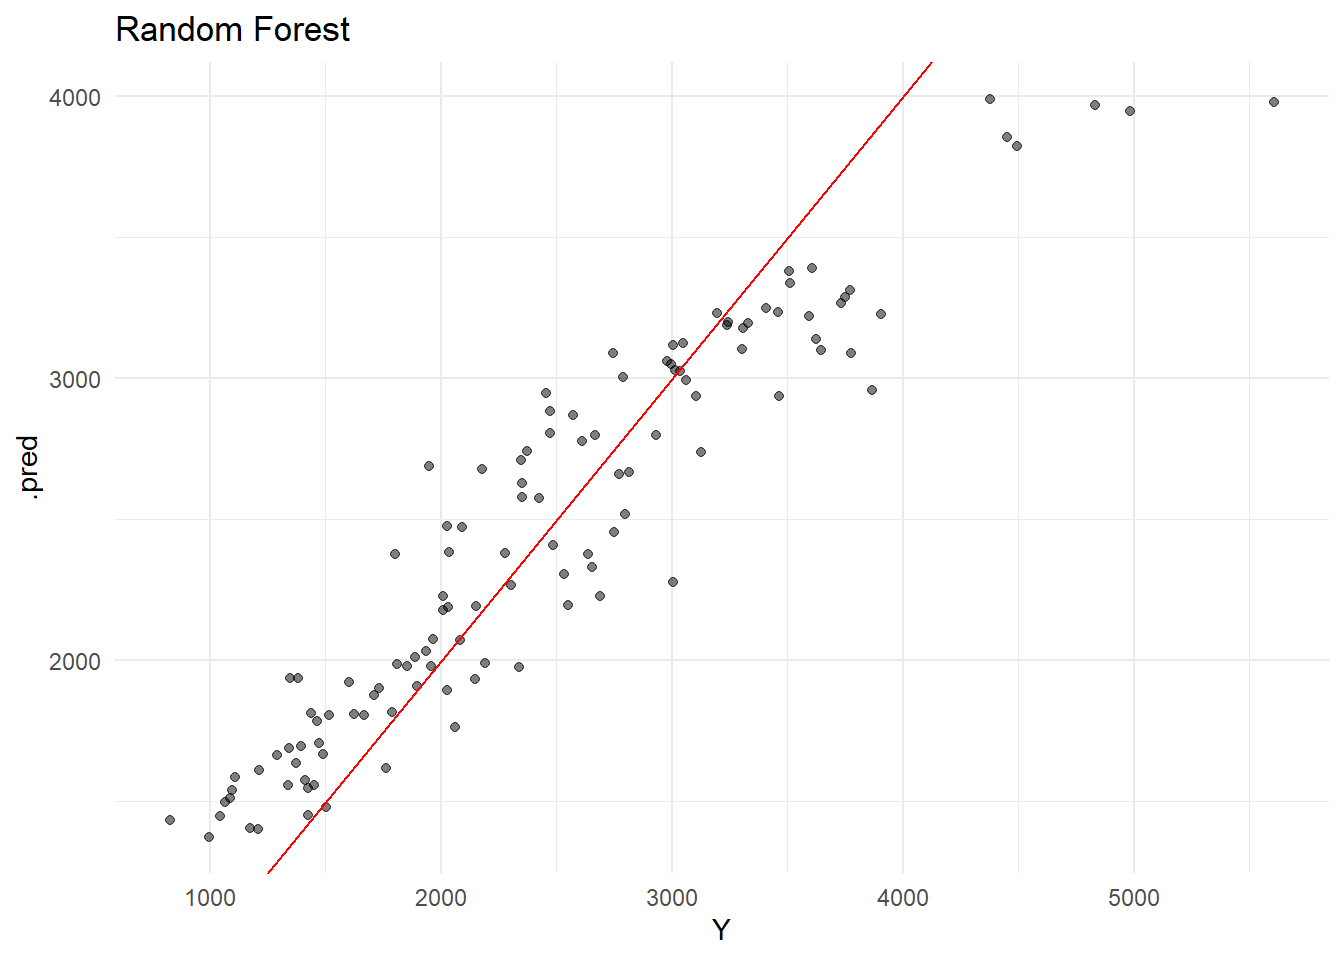
glimpse(model_data)Rows: 120
Columns: 7
$ Y <dbl> 2690.52, 2638.81, 2149.61, 1788.89, 3126.37, 2336.89, 3007.20, 27…
$ DOSE <dbl> 25.0, 25.0, 25.0, 25.0, 25.0, 25.0, 25.0, 25.0, 25.0, 25.0, 25.0,…
$ AGE <dbl> 42, 24, 31, 46, 41, 27, 23, 20, 23, 28, 46, 22, 43, 50, 19, 26, 3…
$ SEX <fct> 1, 1, 1, 2, 2, 1, 1, 1, 1, 1, 1, 1, 2, 2, 1, 1, 1, 1, 1, 1, 1, 1,…
$ RACE <fct> 2, 2, 1, 1, 2, 2, 1, 88, 2, 1, 1, 1, 1, 1, 2, 2, 1, 1, 1, 1, 1, 1…
$ WT <dbl> 94.3, 80.4, 71.8, 77.4, 64.3, 74.1, 87.9, 61.9, 65.3, 103.5, 83.0…
$ HT <dbl> 1.769997, 1.759850, 1.809847, 1.649993, 1.560052, 1.829862, 1.850…